
Last week the Panama Canal reported higher transits 🛳️ & cargo volume in fiscal year 2026, covering October 2025 to September 2026. Vessel transits were up 4.1% compared to the previous fiscal year, reaching a total of 13,951. Growth was driven by chemical tankers and LPG vessel traffic. Container ships continued to account for the largest number of canal transits, totalling 2921. A rise of almost 1%.
Total vessel volume (tonnage) was up 6.5% in FY2026, reaching 521 million PC/UMS tons (Panama Canal Universal Measurement System). Neopanamax locks traffic represented 52.2% of the canal’s total tonnage (PC/UMS tons), an increase of 8.2% compared with the previous year. The rise indicates a growing proportion of larger ships transiting the canal.
Chemical Tankers and LPG Carriers Lead Growth in Transits
Chemical tankers recorded the largest increase in absolute numbers, with 2,578 transits, up by 360 transits or 16.2% from the previous fiscal year. LPG carriers were next with an 8% rise (+145) to 1,950 transits, from 1,805 in FY2025. Oil tanker traffic and vehicle carriers were both up with 73 transits, with increases of 16.4% (total 517) and 8.4% (total 944) respectively.
In relative terms, Liquefied Natural Gas (LNG) carriers recorded particularly strong growth, with transits rising by 93.4% from 61 to 118.
The largest fall was in dry bulk carrier traffic, declining by 93 transits, representing -4.2% (from 2,230 to 2,137 transits), followed by passenger vessels with -15% (from 214 to 182) and general cargo –6.9% (from 463 to 431), both falling 32 transits in absolute numbers.
In relative terms, Liquefied Natural Gas (LNG) carriers recorded particularly strong growth, with transits increasing by 93.4% from 61 to 118.
75% of transits were through the Panamax locks, while 25% of vessels took the Neopanamax locks.
Cargo Volume Rose 7%, Boosted by Container Ships
The cargo volume in weight moved though the Canal rose with 7% to 281 million long tons in FY2026. Containers ship cargo volume saw the largest absolute growth with 7.5 million long tons, up 11.2% (from 67 million to 74.5 million). Chemical tanker volume followed with an increase of 5.6 million long tons (12.2%), totalling 51.7 million tons. Third, was the LPG segment, that grew by almost 3 million tons (7.7%) to 41.4 million tons.
Despite a decline in transits, dry bulk carriers continued to account for the largest physical cargo volume transported through the Panama Canal, totaling 81.4 million long tons, down 2.8% from the previous fiscal year.
Albeit modest in total volume, Liquefied Natural Gas (LNG) carriers recorded particularly strong growth, with cargo volumes increasing by 141.1%, from 1.8 million to 4.3 million long tons.
The most frequent route was East Coast USA to Asia with 37% of the cargo volume in long tons transported (+7.63%).
According to the Panama Canal Authority (ACP), the figures point to a continued recovery in demand, partly supported by changes in global trade patterns. At the same time, the Panama Canal maintained a maximum draft of 50 feet throughout the dry season, offering customers favorable operating conditions.
Administrator Ilya Espino de Marotta noted that the Panama Canal facilitates international maritime trade by providing its customers with a reliable and safe route.
New Revenue Record for the Panama Canal
FY2026 revenue totaled USD 6.6 billion, 16.6% higher than in the previous fiscal year and and a new record. It will help finance strategic investments intended to support the canal’s long-term development, stated ACP.
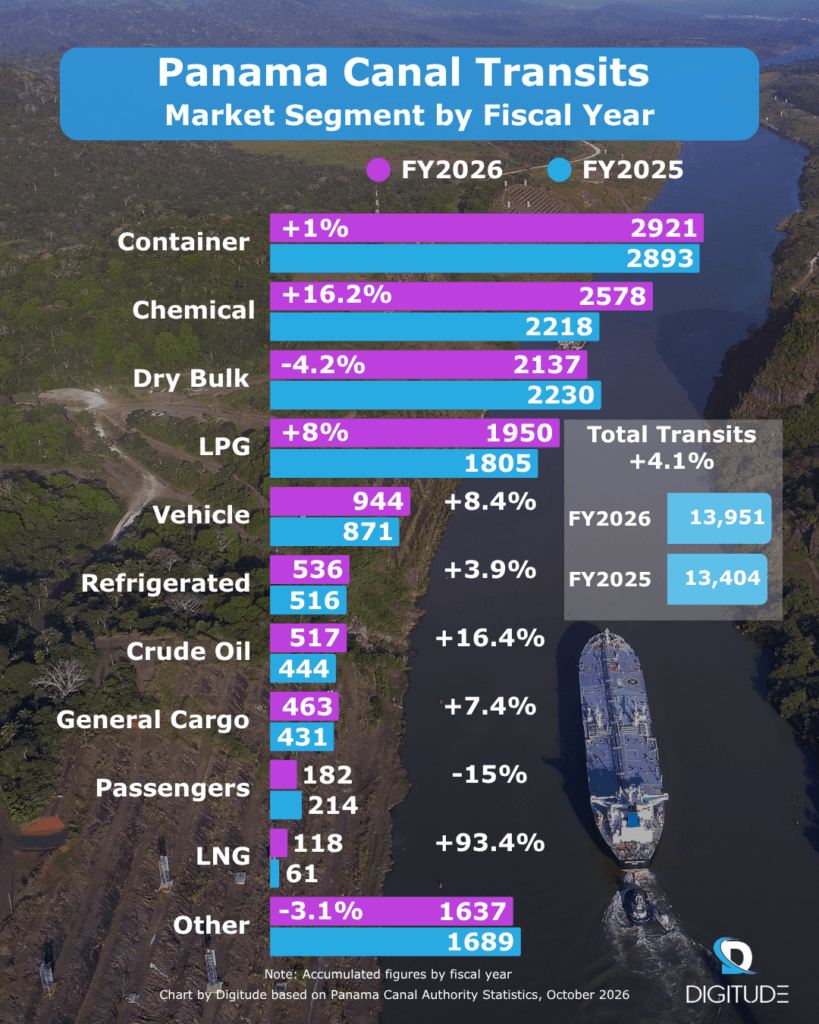
Panama Canal Transit Statistics
FY2026 Results Press Release by the Panama Canal
Subscribe here to our monthly newsletter to stay up-to-date about Panama’s Business Landscape & follow us on LinkedIn!